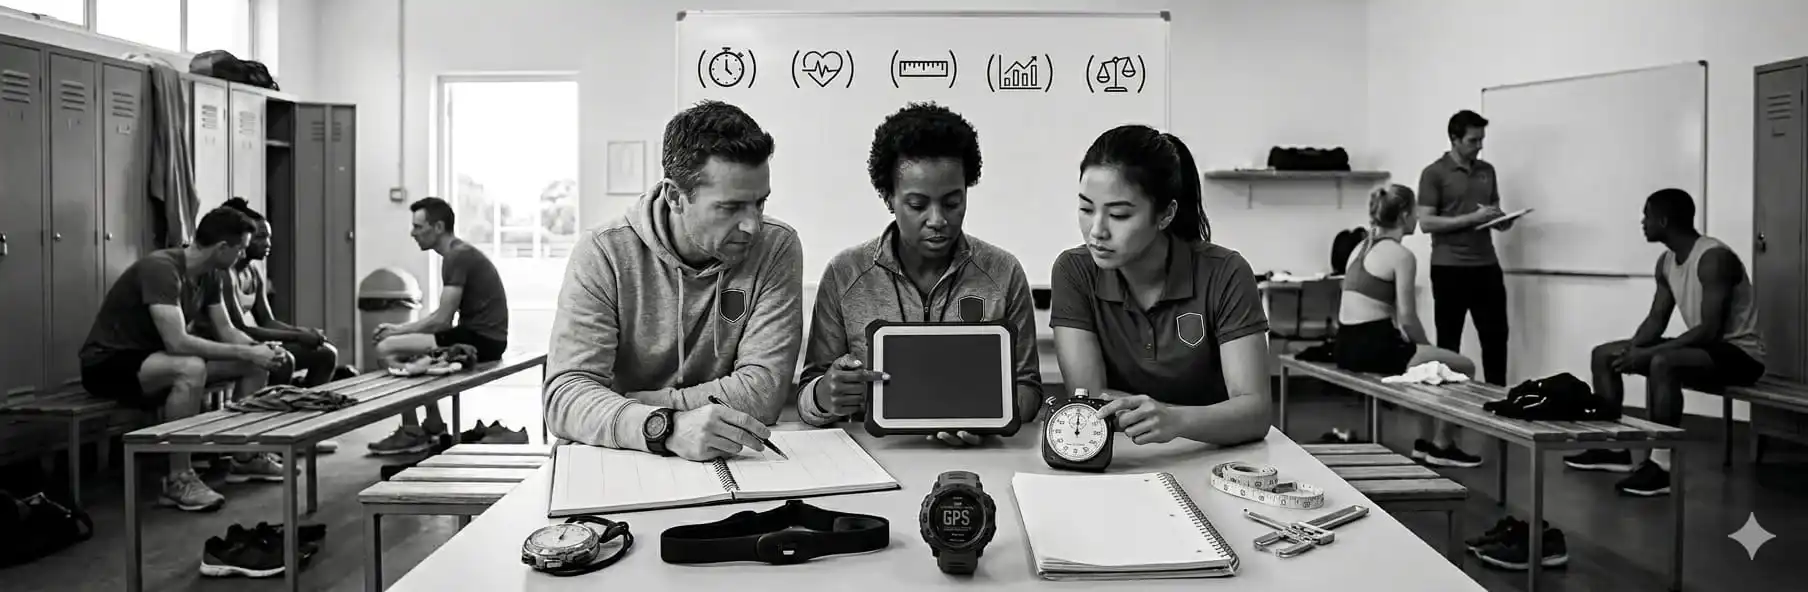
5 Essential Metrics Every Coach Must Track
Discover the five universal metrics that any team sport coach should monitor to make data-driven decisions and improve team performance.
Written by
João Araújo
Physical Education Teacher (FADEUP – University of Porto) · Futsal Coach – Level II · UEFA B License · Master’s in Physical Education
15 years teaching Physical Education in schools, 20 years coaching futsal at youth development level and 5 years coaching football. Federated and amateur football and futsal player.
There are coaches who track everything, yet analyse nothing. And there are coaches who track five things and understand their team deeply. The difference is not the quantity of data, but the choice of the right metrics.
In any team sport, from futsal to basketball to football to handball, there are five metrics that provide a complete picture of team performance. They are independent of the discipline, universally applicable, and when recorded consistently, they reveal patterns that the naked eye could never capture alone.
Metric 1: Total Physical Load (Training Volume)
The first metric is the most fundamental: how much is each player actually working?
Total physical load combines distance covered, time on the field, and effort intensity. It allows the coach to answer critical questions:
- Is this player overloaded or underutilised?
- Is the load distribution between starters and substitutes balanced?
- Is this week’s load consistent with what the team needs for Sunday’s match?
A team arriving at a game with excessive accumulated load faces a higher injury risk and reduced physical response capacity. A team that is underloaded in training may not have the condition to sustain their pace in the final minutes.
How to measure: total distance per session, effective time in play (excluding stoppages), perceived exertion index (Borg scale or similar).
Metric 2: Offensive Efficiency
The second metric answers: is the team creating and converting opportunities effectively?
Offensive efficiency goes beyond the number of goals or points scored. It analyses:
- Conversion rate: shot or scoring attempts versus points or goals obtained
- Quality of opportunities: how many high-probability chances does the team create per game?
- Field progression: does the team advance the play in an organised manner, or does it rely on chance plays?
A team with many opportunities and low conversion has a finishing problem. A team with few opportunities and high conversion has a playmaking problem. These are completely different diagnoses, and they lead to completely different training plans.
How to measure: attempt-to-points ratio, assists per game, finishing attempts in high-efficiency zones.
Metric 3: Turnovers and Possession Rotation
The third metric evaluates: when the team has the ball, can it keep it?
Turnovers are one of the most predictive indicators of the final result. In team sports, possession, whether a pass, a carry, or a contested ball, represents an offensive opportunity. Every turnover is an opportunity handed to the opponent.
The types of turnover reveal specific problems:
- Errant passes under pressure: technical or decision-making issue
- Losses from lack of communication: system problem
- Losses from excessive individual effort: tactical problem
Monitoring this indicator per player and per zone of the field allows the coach to identify where the team is most vulnerable. For example, a team that systematically loses the ball down the left channel of midfield may have a specific support problem in that zone, not a general passing technique issue.
How to measure: number of turnovers per game, by field zone, by player, and by context (high press vs. low press).
Metric 4: Explosive Actions (Sprints and Accelerations)
The fourth metric focuses on the quality of physical effort, not just the volume.
In team sports, decisive moments are often determined by high-intensity actions: a sprint to recover the ball, an acceleration to create space, a well-timed jump. These actions are the true indicator of a team’s explosive physical condition.
Tracking explosive actions over a season reveals:
- Whether the team’s physical condition is growing, stabilising, or deteriorating
- Whether certain players have the physical capacity to sustain effort in the final minutes
- Whether the squad rotation strategy is effectively maintaining intensity
How to measure: number of sprints per game (efforts above 85% of maximum speed), accelerations, jumping or high-intensity contact actions.
Metric 5: Defensive Discipline
The fifth metric evaluates: does the team defend in an organised way without creating unnecessary risks?
Defensive discipline goes beyond fouls committed and cards received, though those are important indicators. It also includes:
- Fouls per game and per period: is the team becoming more undisciplined as the game progresses (a sign of fatigue)?
- Quality of fouls: are they controlled tactical fouls or impulsive reactions?
- Direct defensive errors: how many danger situations result from poor defensive organisation?
A disciplined defensive team controls the game even under pressure. An undisciplined team offers the opponent free opportunities that the data, sooner or later, will record.
How to measure: fouls per game, cards received, defensive errors resulting in clear opponent opportunities, percentage of 1-on-1 situations successfully defended.
The Value of Consistent Recording
Each of these five metrics has value in isolation. But their real power emerges when recorded consistently over time: game after game, week after week.
That is where patterns appear: the team that loses more balls when tired, the player who performs best at the start of the season, the phase of the game where offensive efficiency collapses.
Those patterns are invisible without data. With data, they become decisions.
To track these metrics in real time during your matches, the SportsLabTools Futsal Scoreboard lets you log goals, fouls and game events in one tap, automatically building the statistical history that supports all of this analysis.
The best coach is not the one who sees the most. It is the one who best understands what they see.