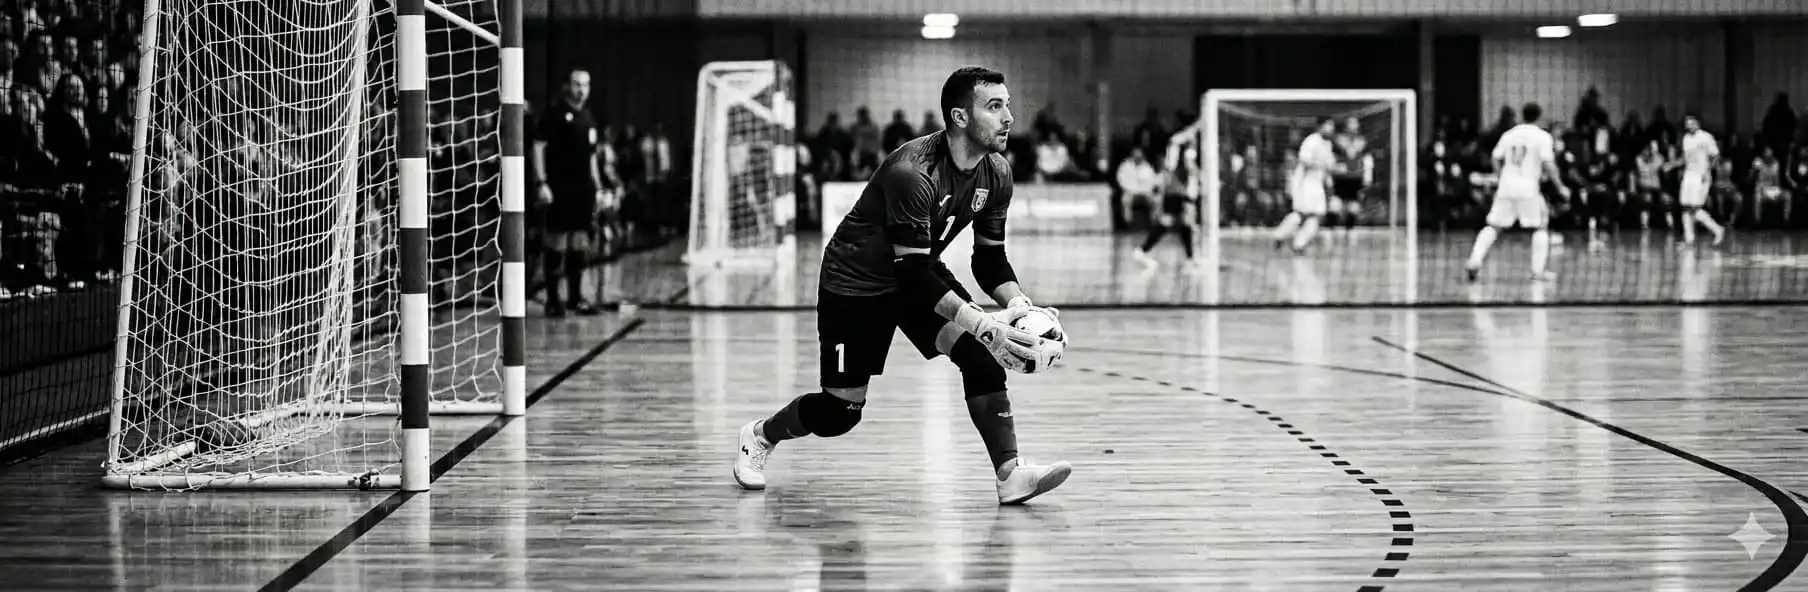
How to Analyse Futsal Goalkeeper Statistics: Beyond Saves
A complete guide to futsal goalkeeper statistics: traditional, advanced, and situational metrics. Move beyond saves and evaluate the keeper as a complete player in the modern game.
Written by
João Araújo
Physical Education Teacher (FADEUP – University of Porto) · Futsal Coach – Level II · UEFA B License · Master’s in Physical Education
15 years teaching Physical Education in schools, 20 years coaching futsal at youth development level and 5 years coaching football. Federated and amateur football and futsal player.
Counting a goalkeeper’s saves is like judging a coach solely by win percentage. It is not wrong. It is incomplete. The modern futsal keeper is as much an offensive piece as a defensive one, and their statistics have to reflect that. A keeper can make ten saves in a match and still be the reason the team conceded three counter-attacks through poor distribution during the pressure exit.
Statistical analysis of futsal goalkeepers is in a transitional phase. Most amateur coaches still look only at saves and goals conceded. More progressive ones are starting to question what those numbers fail to tell them. This article organises available metrics into three layers. Traditional, advanced, and situational. And explains when to use each.
Traditional Metrics: What They Measure and What They Hide
Saves made
The most widely used and most misread metric. The saves count tells you defensive volume. How often the keeper was called upon. But nothing about the quality of what they faced.
What it measures: defensive presence, workload, number of times tested
Limitation: directly dependent on how many shots the team conceded. A keeper with 12 saves may be compensating for an exposed defence; one with 4 saves may have been backed by an excellent collective defensive performance.
When to use: comparing keepers with similar exposure (same system, similar shots faced per game).
Goals conceded / Save percentage
Save percentage (saves divided by total shots on target) is more informative than the raw goals count because it normalises for exposure.
What it measures: defensive efficiency across the shots they were asked to stop
Limitation: does not account for shot quality. A 75% save rate may reflect an average keeper facing many difficult shots or a poor keeper facing easy ones.
When to use: longitudinal analysis of the same keeper across a season. The percentage trend is more revealing than any single-match absolute figure.
Advanced Metrics: The Keeper as an Outfield Player
Pressure Exit Participation Rate
In modern futsal, the keeper is the first player in the attacking organisation. The pressure exit often starts with them. Whether with a long pass to escape the opponent’s high press, or a combination with the fixo to build possession.
What it measures: the percentage of pressure exit situations where the keeper actively participates. Receiving the ball, demanding it, or initiating the progression
Why it matters: a keeper who refuses to engage in pressure exits forces the team into longer, more predictable transitions, increasing the risk of losing the ball in their own half.
How to measure: manual count per game (feasible with video); approximate proxy of “passes completed in defensive zones”
Passes Completed per Game
The modern futsal keeper is the fifth outfield player when the team has possession. Their ability to circulate the ball with quality. Especially under pressure. Is a genuine tactical component.
What it measures: volume and efficiency of the keeper’s offensive contribution
Important distinction: short, safe passes (to the fixo five metres away) must be separated from progressive passes (to the winger in depth, or to escape the press). A keeper with 15 completions, all short and lateral, tells you little; one with 8 completions, four of which are progressive, tells you a great deal.
When to use: comparing two keeper candidates for a starting berth; assessing the evolution of the team’s attacking model.
Expected Goals Against (xGA) vs Goals Against
xGA is the most sophisticated metric available for keeper evaluation. Rather than simply recording the outcome (goal or save), it assigns each shot a goal probability based on criteria such as distance, angle, type of action (set piece, open play, counter-attack) and pressure on the shooter.
What it measures: how many goals it was “expected” to concede (based on shot quality received) versus how many were actually conceded. A keeper who concedes fewer than their xGA is outperforming expectations; one who concedes more is underperforming.
Limitation: requires an xG model, which means more detailed data collection. Shot distance and angle at minimum.
When to use: high-precision analytical context, video combined with data, or when the coach wants an objective answer to “is this keeper making a difference beyond what you would expect from anyone in goal?”
Situational Metrics: Context That Changes Everything
Performance during active 5v4 (keeper pushed up)
The 5v4 is a unique futsal moment where the keeper stops being a keeper and becomes a fifth outfield player. Their actions in this context. Involvement in circulation, pressing the ball carrier, positioning in counter-attack situations. Are entirely different from standard defensive metrics.
What it measures: the keeper’s real impact at the moment of highest risk and highest opportunity in the game
How to measure: record keeper actions separately during 5v4 periods (ball touches, goals scored, involvement in finishing situations)
Saves in the final 5 minutes (pressure situations)
A keeper who performs well when the team is two goals ahead may have a completely different profile when the match is level and the opposition pushes desperately. Saves in the closing minutes are the most demanding test of mental and technical quality.
What it measures: performance under extreme pressure. The moment when an error carries the highest cost
When to use: comparing two keepers with similar technical profiles; analysing mental resilience and composure.
How to Combine the Three Approaches
Before analysing a keeper, three questions guide the process:
- What is the context of the analysis? Scouting ahead of a transfer requires more detailed metrics than routine post-match review.
- What specifically do I want to know? If the question is “is the keeper performing well defensively?”, save percentage and xGA answer that. If the question is “does the keeper fit our playing model?”, pass metrics and pressure exit participation are more relevant.
- Do I have the data, or do I need to collect it? Some metrics require video and manual logging; others can be pulled directly from a match statistics tool.
🔧 Stats Tool
Logging these metrics game by game allows you to compare keepers across the season and identify trends a single match cannot reveal. The SportsLabTools Stats Tool lets you record and track keeper metrics. Saves, passes, participations. And build a comparative history across the season.
Comparison Table: Goalkeeper Metrics
| Metric | What it measures | Limitation | Best use |
|---|---|---|---|
| Saves made | Defensive volume | Depends on shots faced | Comparing keepers with equal exposure |
| Save percentage | Defensive efficiency | Ignores shot quality | Longitudinal analysis of the same keeper |
| Passes completed | Offensive contribution | Skewed by short safe passes | Evaluating playing style and attacking model |
| Pressure exit participation | Leadership of the press exit | Hard to count without video | Video + statistics combined |
| xGA vs GA | Quality vs actual outcome | Requires an xG model | High-precision analytical context |
| 5v4 performance | Impact as outfield player | Very specific context | Analysing the team’s game system |
| Final 5-minute saves | Resilience under pressure | Small sample in many games | Comparing mental profile |
See also: The Modern Futsal Goalkeeper: Role in 5v4 and Pressure Exit. To understand the tactical functions these metrics are designed to measure.
Conclusion
Futsal goalkeeper statistics only have value when interpreted with context. Saves and save percentage answer one part of the question. The defensive part. But ignore the offensive dimension that defines the modern keeper. Advanced metrics (passes, pressure exit participation, xGA) and situational metrics (5v4, final minutes) complete the picture.
The goal is not to use every metric in every match. It is to know which metric answers which question. And to have the data ready when you need to ask it.
Log your keeper’s metrics game by game. Use the SportsLabTools Stats Tool to build a comparative history and evaluate your keeper with more than just a saves count.
Optional accelerator · the tool is always free
Reliable stats as soon as the next match
An action taxonomy ready for live logging from the bench, with pitch and goal location already active — heat maps and shot maps without configuring anything.